
One page dominated AI answers. Then seventeen showed up the same day.
In January we thought we had cracked it. One day brought 1,354 citations. Screenshots everywhere. High fives. Then the numbers settled, and May told a different story: fewer total citations, but 17 different pages cited in a single day. That is when we stopped chasing spikes and started publishing cluster content built using Zelitho on a steady cadence. Breadth, not noise, is what held.
Jan peak → May peak
citations
citations
per day in May
Source: Bing Webmaster Tools AI Performance timeline export (Jun 2026). Citations are visible source references in AI answers, not clicks. Methodology and definitions.
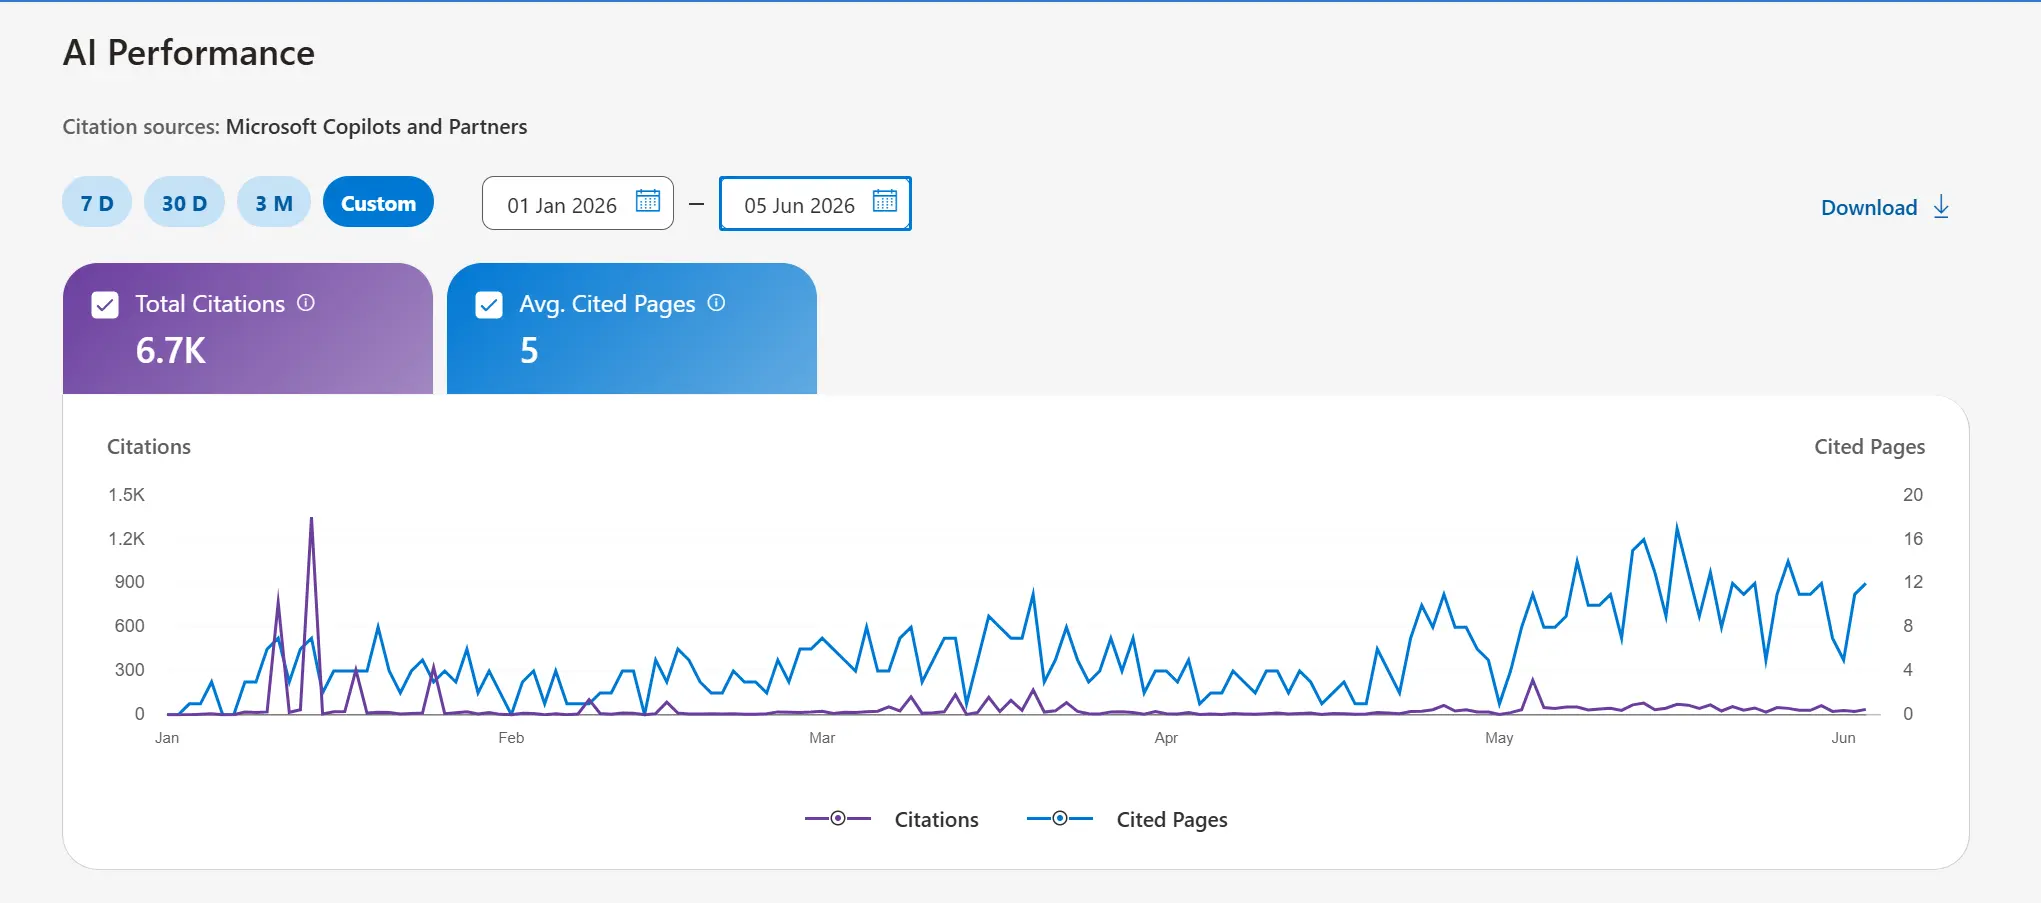
Fewer citations. Stronger system.
We celebrated January because the headline number was huge. May looked like a step backward until we opened the Cited Pages column. January maxed at 8 pages cited in one day. May hit 17. Our first case study showed one GEO audit checklist earning 3,258 AI citations while Google sent 2 clicks. That post opened the door. May proved the rest of the library could walk through it.
Five months in four chapters
This is not a growth chart brag. It is the story of how AI visibility on zelitho.com moved from one loud breakout to a shelf of cited pages. Each chapter maps to a phase we actually lived through.
January: Breakout
The first two days of January showed zero citations in our export. Then visibility arrived fast. Jan 11: 768 citations. Jan 14: 1,354. One checklist post dominated. Exciting. Fragile. We had a spike, not yet a system.
February: Hangover
February brought 400 citations for the full month. Easy to panic. Easy to call it a failed experiment. In hindsight it was a reset. The spike had burned bright. The work was building what could sustain.
March: Second wave
March climbed to 1,209 citations. More importantly, up to 11 pages cited in one day and a 5.6 page daily average. Sibling posts entered the set: the Complete GEO guide, AEO metrics, GEO vs SEO vs AEO. Not one hero URL. A cluster.
| Month | Citations |
|---|---|
| January | 3,059 |
| February | 400 |
| March | 1,209 |
| April | 414 |
| May | 1,537 |
April to May: System
May did not beat January on total volume. It beat January on breadth. Max 17 pages cited in one day. Average 10.3 pages per day. On May 4 alone: 238 citations across 11 pages. That is the metric we watch now: how many URLs can AI cite today?
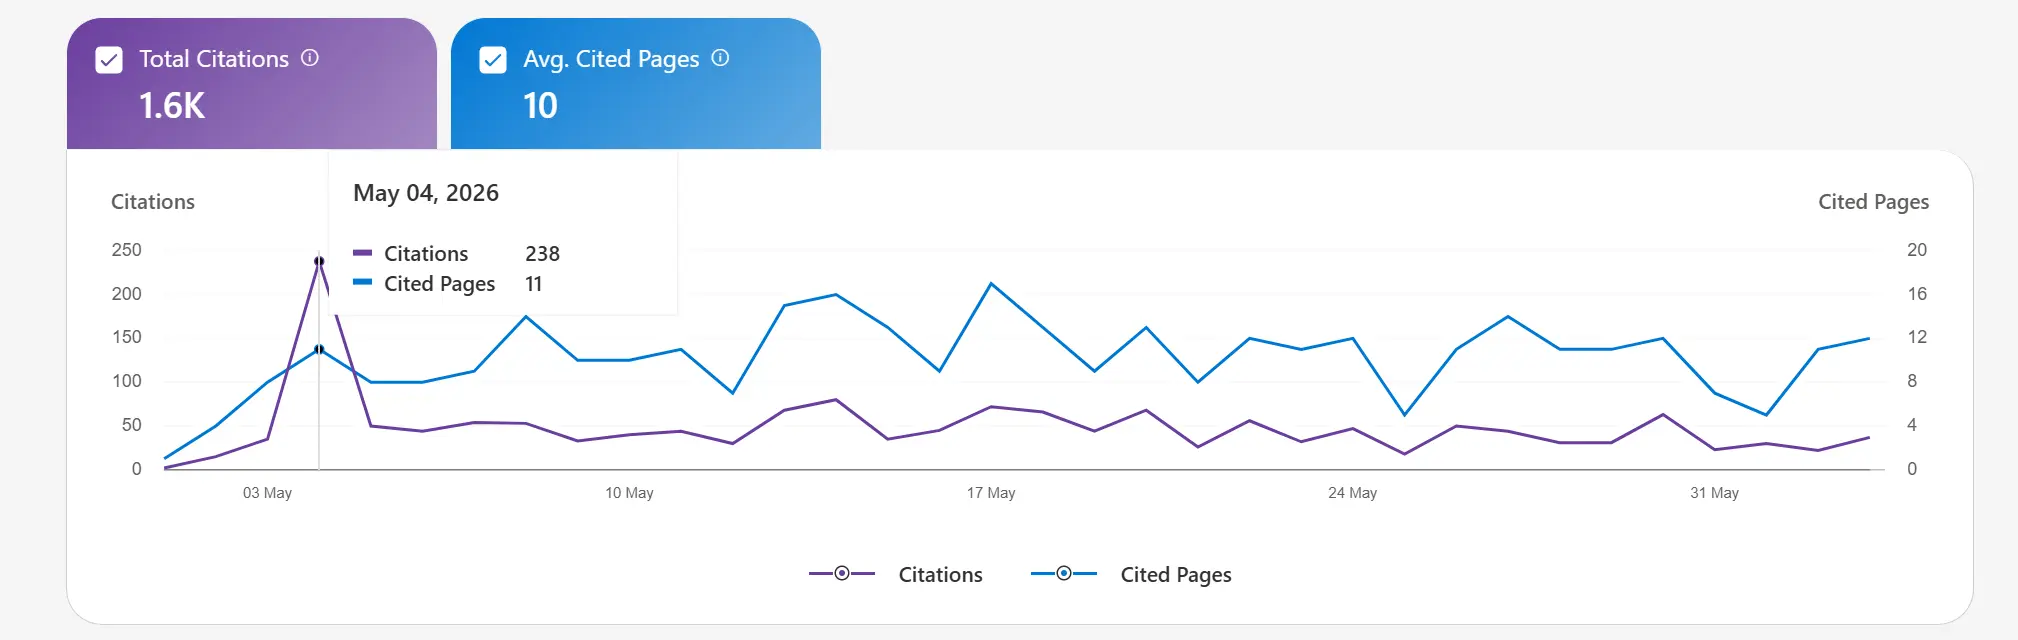
The metric we wish we tracked from day one
One spike page is fragile. Query drift, one URL going stale, an algorithm shift, and the number collapses. Many cited pages per day is resilient. That is why we track cited pages and average cited pages, not headline totals alone.
Breakout asset
The GEO audit checklist earned 3,258 page-level citations over the window. It proved demand. It did not carry May alone.
Cluster depth
Complete GEO guide (592), AEO metrics (463), GEO vs SEO vs AEO (340). Siblings built using Zelitho, cross-linked from the breakout post.
Steady publishing
Not random topics. Retrieval-ready assets in the same GEO/AEO graph, published on a cadence instead of chasing the next spike.
Monthly machine loop
Export timeline and pages. Track cited-pages-per-day. Refresh one cluster asset. Compare month over month.
“January was loud. May was distributed.”
Zelitho content teamWhat we would do again
If you get one breakout page in AI search, do not assume the headline number will repeat. Assume you have a narrow window to build the cluster around it before the spike fades.
Start with Google ignored it. AI quoted it 3,258 times., our case study on one blog post with 444 Google impressions and 3,258 AI citations. This page is what happened to the whole site after that breakout.
“We stopped asking did we spike? and started asking how many pages can AI cite today?”
What changed our publishing rhythmSix steps after your first AI citation spike
Repeatable workflow for teams moving from one URL to a cited library.
- 1Expect a hangover month. February-style dips after a January spike are normal. Do not abandon the strategy.
- 2Track cited pages per day, not only citation totals.
- 3Publish cluster siblings on the same topic: guides, metrics posts, comparison articles.
- 4Cross-link from the breakout URL to 2 or 3 supporting pages.
- 5Export the timeline monthly. Label spike days as observational only.
- 6Refresh winners on a schedule so AI systems reference current information.
Source data
All metrics below come from Bing Webmaster Tools AI Performance timeline and Pages exports, dated June 5, 2026.
| Metric | Value | Source |
|---|---|---|
| Total timeline citations | 6,671 | Timeline export sum |
| Days tracked | 153 | Timeline export |
| January citations | 3,059 | Sum of daily Jan rows |
| February citations | 400 | Sum of daily Feb rows |
| March citations | 1,209 | Sum of daily Mar rows |
| April citations | 414 | Sum of daily Apr rows |
| May citations | 1,537 | Sum of daily May rows |
| Jan max pages cited/day | 8 | Timeline Cited Pages max |
| May max pages cited/day | 17 | Timeline Cited Pages max |
| May avg pages cited/day | 10.3 | Mean of May Cited Pages |
| Jan 14 citations | 1,354 | Single-day row |
| Jan 11 citations | 768 | Single-day row |
| Cited pages (site total) | 44 | Pages export |
| Date range | Jan 1 to Jun 2, 2026 | Export filenames |
What this case study does not prove
- May having fewer citations than January is not failure when cited-pages-per-day increased.
- Timeline data is sampled and aggregated.
- Scope is Microsoft Copilot, Bing AI summaries, and select partners.
- Spike days cannot be attributed to a single cause, page, or publish date.
- Citations are not clicks, traffic, or engagement.
Frequently asked questions
Why is May better with fewer citations than January?
May reached up to 17 pages cited in one day versus January’s max of 8. That means broader library reach across multiple URLs, not one spike post carrying the month.
What happened on January 14?
The timeline export shows 1,354 site-wide citations that day with 7 cited pages. This is observational spike data only. It cannot be tied to one cause or one page.
What is cited pages per day?
The count of unique URLs from your site that were visibly cited in AI-generated answers on a given day.
Did citations only go down after January?
No. February dipped to 400, then March rebounded to 1,209. Growth was non-linear: breakout, hangover, cluster, breadth.
How does this relate to the breakout checklist?
Google ignored it. AI quoted it 3,258 times. covers that one checklist post. This page covers what happened to the whole site across the next months.
Do citations equal traffic?
No. Citations are visible source references in AI answers, not clicks or engagement.
How do I track this on my site?
Export Bing AI Performance timeline data monthly. Watch the Cited Pages column, not citations alone.
References
Methodology definitions summarized from Microsoft Bing Webmaster Tools AI Performance documentation.
- Timeline citations and cited pages. Total citations counts visible source references in AI answers over the date range. Cited pages is the number of unique URLs from your site cited on a given day. Average cited pages is the mean unique URLs cited per day. AI Performance reflects Microsoft Copilot, Bing AI summaries, and select partner integrations.
- Grounding queries. Grouped phrases representing key terms the AI used when retrieving cited content. Not full user prompts. One query can map to multiple pages.
- Citations vs engagement. A citation indicates content was visibly referenced in an AI-generated answer. It does not represent traffic, clicks, or user engagement.
- AI vs traditional search metrics. Grounding and citations show how AI systems use your content to generate answers. This differs from rankings, clicks, and traffic.
- Content practices for AI inclusion. Align with user intent; use clear structure; strengthen depth across related topics; keep content fresh and accurate.
- Data sampling and timeline caveats. AI Performance data is aggregated and summarized. Timeline trends are observational and cannot be attributed to a single cause, event, or page.
- Measuring on your site. In Bing Webmaster Tools, open AI Performance. Export timeline, page-level citations, and grounding queries as CSV or Excel. Re-export monthly.
Definitions above are paraphrased for readability. Export filenames dated June 5, 2026.
Source: Microsoft Bing Webmaster Tools. AI Performance in Bing Webmaster Tools
One spike is luck. A cited library is work.
Start with Google ignored it. AI quoted it 3,258 times., then build your cluster using Zelitho and export the timeline monthly to watch cited pages grow.