
What Is Search Visibility in SEO? A Clear Definition

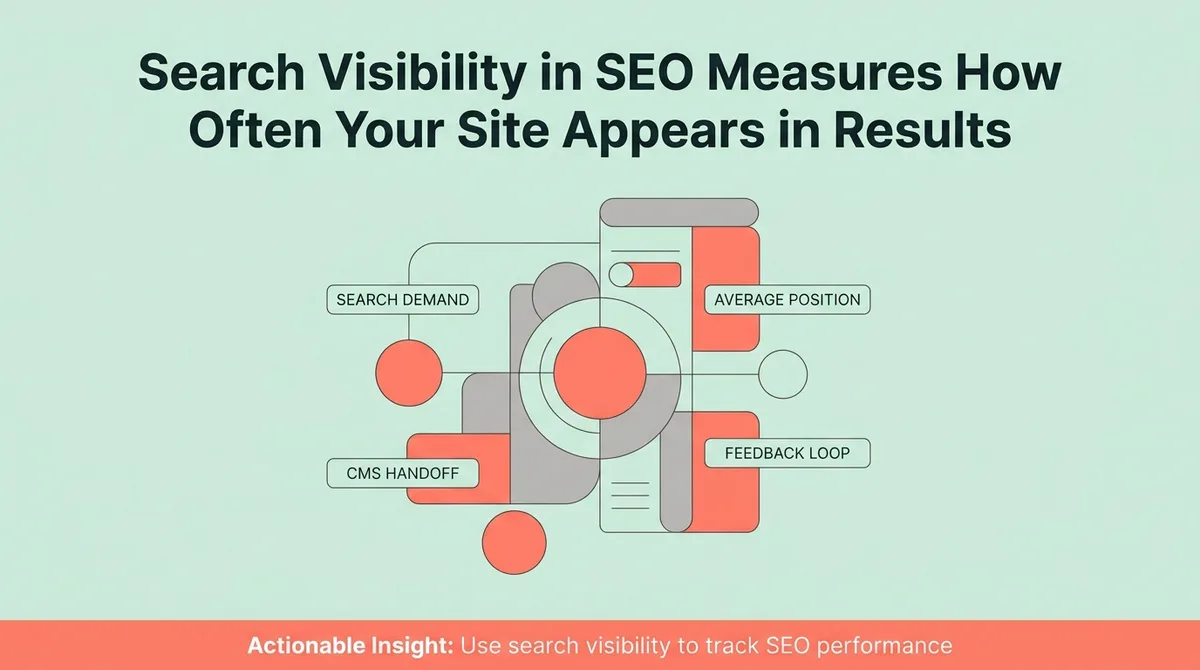
Search visibility in SEO is an aggregate percentage metric that estimates the proportion of organic clicks and search impressions a website captures across a target keyword portfolio. In 2026, the definition has expanded to incorporate your AI visibility score, measuring citation share of voice across generative answer engines like ChatGPT, Perplexity, and Google AI Overviews. Tracking both traditional search visibility and generative citation frequency enables marketing teams to diagnose organic traffic shifts and prove answer engine optimization ROI.
TL;DR
You open the content dashboard on a Tuesday and the blog hasn’t published in eleven weeks. The ChatGPT drafts are sitting in Google Docs. The freelancer is waiting on feedback. The CMS handoff stalled again. Meanwhile, you have no clean number to show the founder or the client.
Tracking average ranking position feels logical, but it hides too much. A page can rank sixth for five keywords and show a respectable average while capturing almost no actual search demand.
Search visibility solves that by combining ranking position and keyword search volume into one percentage score. A 3.11% visibility score across a tracked keyword set [2] tells you exactly how much available demand you are capturing. Marketing leads and agency founders running multiple client accounts use this number to spot drops early, prioritize fixes, and report progress without guesswork.
What does search visibility mean in SEO?
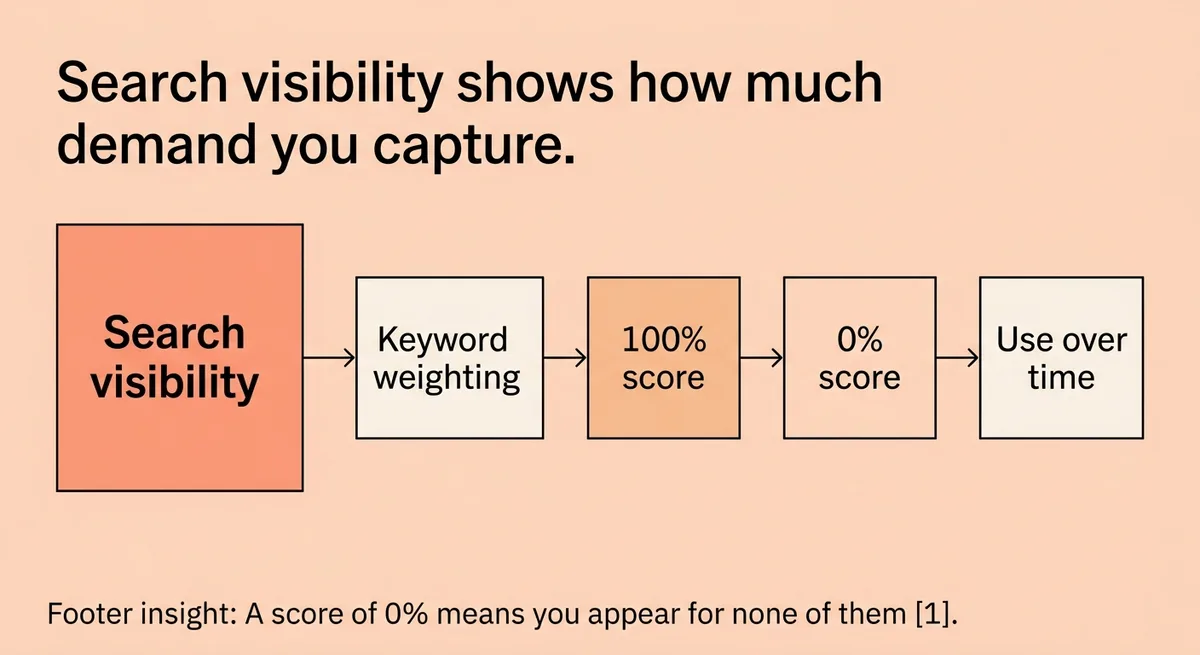
Search visibility is a percentage that tells you how much of the total search demand for a tracked keyword set your site captures. It weights each keyword by search volume and adjusts for your ranking position. A score of 100% means you rank first for every tracked keyword. A score of 0% means you appear for none of them [1]. Most sites sit somewhere in between, and the number only becomes useful when you compare it over time or against competitors.
Search Visibility Is a Percentage, Not a Ranking
Your average ranking position tells you where you sit. Search visibility tells you how much of the available demand you are actually reaching.
These are different things. A site can hold an average position of 4.2 and still capture almost nothing if its tracked keywords carry low search volume. Position is a placement stat. Visibility is a demand stat.
The calculation weights every tracked keyword by its monthly search volume, then applies a click-share estimate based on your ranking position. Add up those weighted shares and divide by total possible demand. The result is your score. At 100%, you rank first for every keyword in your tracked set [1]. At 0%, you rank for none of them [1]. At 50%, you are roughly halfway to capturing all available demand in that set [1].
Here is why that matters for a content team reporting to a founder. A visibility score of 24.45% versus a competitor sitting at 0.6% across the same ten tracked keywords [1] tells you immediately where the gap is. Average position does not show you that comparison cleanly.
One point worth sitting with: a page ranking on page one for ten low-volume keywords can look healthy in a rank tracker while driving fewer visits than a single page ranking fifth for one high-volume term.
Stop tracking average position as your primary content health metric. Start tracking visibility against a defined keyword set so volume and placement get measured together.
The Two Inputs That Actually Determine Your Score
Two variables control your visibility score. Ranking position is the first. Keyword search volume is the second. Adjust only one and your score may not move at all.
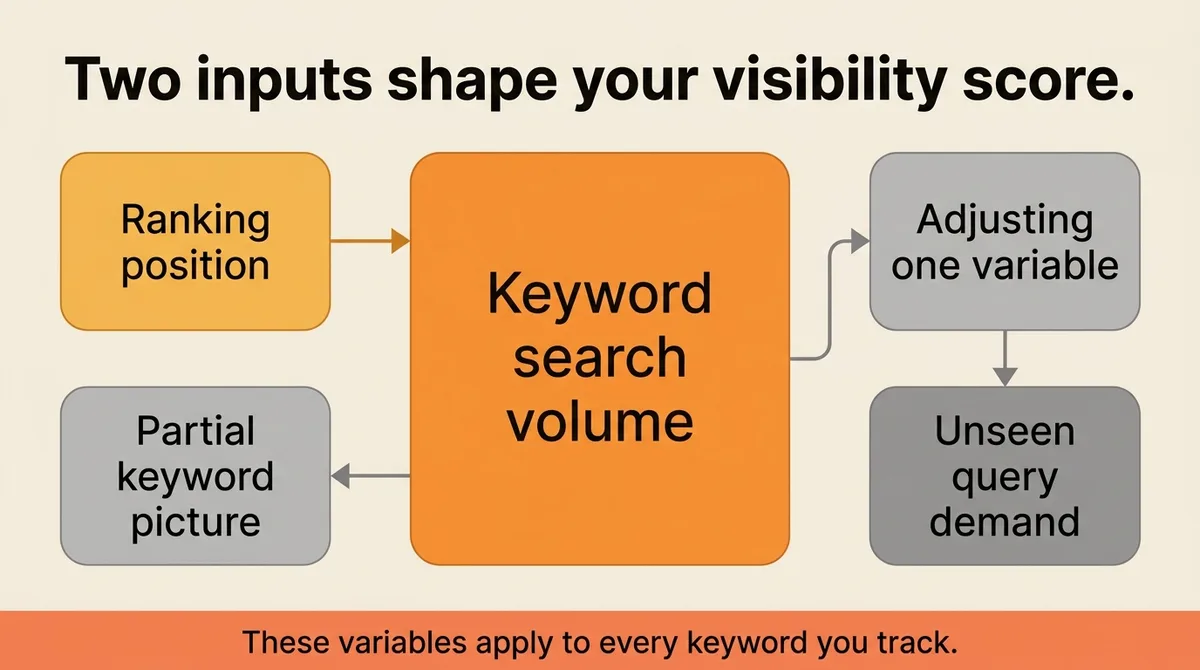
Roughly 15% of daily Google queries have never been searched before [3]. That means a meaningful portion of the keyword opportunities your site could capture do not exist in any database yet. Your tracked keyword set is always a partial picture. The variables below apply to every keyword you do track.
Input | What It Measures | What Breaks Without It |
|---|---|---|
Ranking position | Where you appear in results for a keyword | Moving to position 2 from position 8 shifts score, but only proportionally to volume |
Keyword search volume | Monthly demand for that keyword | Ranking first for zero-volume terms produces near-zero score change |
Click-share weight | Estimated clicks at your position | Ignoring this conflates placement with actual demand captured |
Improving your ranking from position 8 to position 2 on a keyword with 50 monthly searches moves your visibility score by a small fraction. Improving your ranking from position 8 to position 2 on a keyword with 5,000 monthly searches moves it materially. Same positional gain. Entirely different score impact.
This is the implementation caveat most content teams miss. They celebrate ranking improvements without checking the volume attached to those keywords. A climb from page two to page one on a keyword with 40 monthly searches generates a click-share change of roughly 5% on a small base [2]. That is meaningful for that keyword and nearly invisible in the overall score.
Filtering your keyword targets to a difficulty range below 30% PKD [1] helps identify terms where a ranking gain is both achievable and worth the effort. Pairing that filter with volume data shows you where a position improvement would actually register in your score.
For informational queries, long-tail keywords also create an opening into AI Overviews [1], which now appear on a measurable share of results pages. More on that in the next section.
Why a Good Visibility Score Can Still Hide a Traffic Problem
A rising visibility score does not guarantee rising traffic. This is the part most reporting skips.
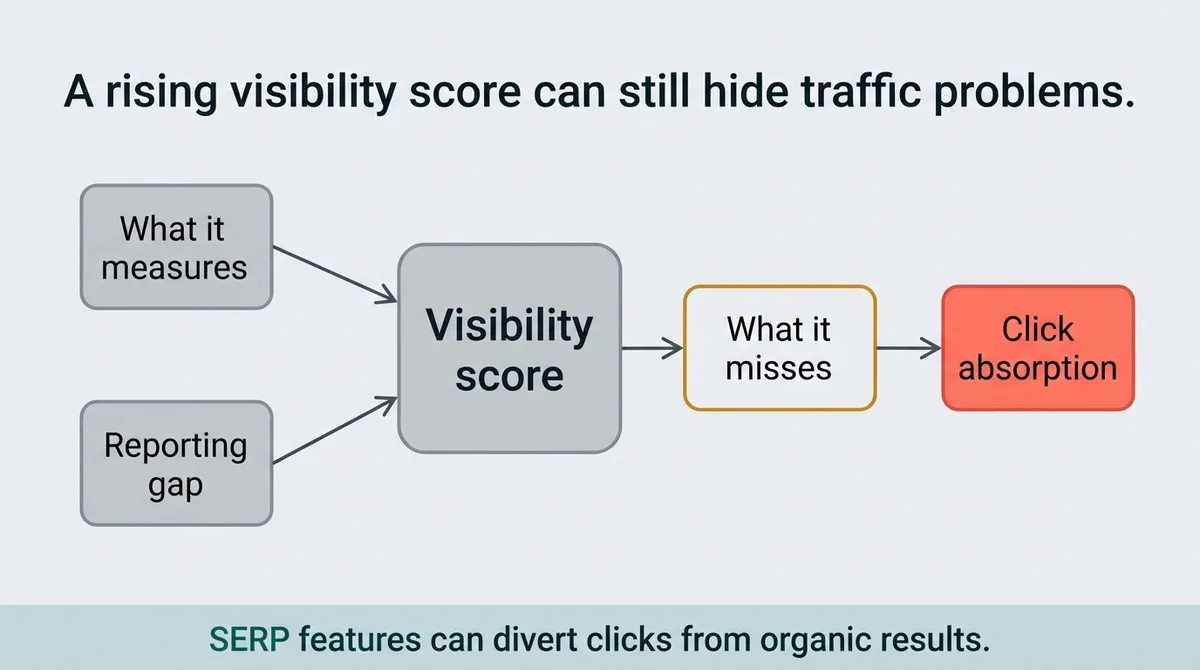
Your score reflects your ranking position relative to your tracked keyword set. It does not account for what else appears on the page above, beside, or between your result and the user. SERP features absorb clicks before they reach organic listings, and they appear at rates that are now too high to ignore.
Across top 20 Google results in U.S. desktop searches on August 14, 2025 [1]:
- Image packs appear on 65.53% of results pages [1]
- People Also Ask appears on 34.53% of results pages [1]
- Knowledge panels appear on 23.56% of results pages [1]
- Local packs appear on 17.42% of results pages [1]
- AI Overviews appear on 14.49% of results pages [1]
- Popular products appear on 13.25% of results pages [1]
- Top stories appear on 4.96% of results pages [1]
- Recipes appear on 1.71% of results pages [1]
- Featured snippets appear on 1.24% of results pages [1]
Image packs appear on nearly two-thirds of all results pages. You can rank third organically and still find your result pushed below the fold by a row of images, a knowledge panel, and a People Also Ask expansion. Your visibility score does not capture that displacement.
Here is what this means in practice. A content lead at a B2B SaaS company saw visibility climb from 18% to 26% over one quarter. Organic sessions barely moved. The keywords driving the gain were triggering AI Overviews and People Also Ask boxes. Clicks went to those features, not to the organic listings below them. The score looked good. The traffic did not follow.
The fix is not to stop tracking visibility. Check which SERP features are active for your highest-volume tracked keywords before concluding that a score increase means traffic is coming. Open your rank tracker, pull the top twenty keywords by search volume, and note which features appear for each. If AI Overviews or image packs dominate, your click-share estimate is lower than your position alone suggests.
Two questions worth running against every visibility report:
- Which SERP features appear most on the keywords driving our score?
- Does our Google Search Console click data confirm the trend the visibility score suggests?
If the answers diverge, the score needs context before it goes into a client report or a founder update.
How to Read, Compare, and Act on Your Visibility Score
A raw visibility percentage means little without a reference point. The number becomes useful when you compare it across three dimensions: time, competitors, and keyword segments.
Compare over time first. A visibility score of 3.11% [2] for a tracked keyword set is not inherently good or bad. Compared to 1.8% six months ago, it signals real progress. Compared to 4.4% six months ago, it signals a problem worth investigating before the drop shows up in revenue.
Compare against competitors second. Three sites tracking ten keywords each might score 24.45%, 14.45%, and 0.6% respectively [1]. That spread tells you more than any single score does in isolation. The site at 0.6% is not in the same competitive position as the site at 24.45%, even if both rank on page one for one or two terms.
Segment your keyword set third. Tracking all keywords together blurs the signal. Break your set into branded terms, non-branded informational terms, and non-branded commercial terms. A visibility score for each segment tells you where you are strong and where you are losing demand.
Here is the repeatable process for the three-step segmentation process:
Step | Action | Output |
|---|---|---|
1. Segment | Split tracked keywords by type: branded, informational, commercial | Three separate visibility scores |
2. Monitor | Check each score on a fixed cadence, weekly or biweekly | Early detection of drops before they compound |
3. Prioritize | Filter for keywords under 30% PKD [1] where your ranking is position 5–15 | A short list of high-leverage improvements |
The third step is where most teams stall. They have the visibility score. They know a segment dropped. They do not have a clear next keyword to fix. Filtering for low-difficulty terms where you already have some presence, positions five through fifteen, gives you the shortest path to a score improvement. A move from position 12 to position 4 on a keyword you already rank for requires less new content than building a new page from scratch.
Backlinks remain a top ranking factor in Google’s evaluation [2]. A page sitting at position 9 on a high-volume keyword with strong relevance but few links is a cleaner leverage point than a page on a different topic entirely. The visibility score points you to the segment with the drop. The keyword filter narrows it to the specific page worth improving.
Knowing which page to fix is only useful if you can actually act on it fast. Most teams lose the gain here – the improvement gets identified, then sits in a backlog because drafting and publishing run through separate tools and people. Zelitho closes that specific gap: it takes a prioritized keyword straight into a research-backed draft and out to your CMS, so a segment drop identified on Monday can have a live fix by the end of the week instead of the end of the quarter.
Run this process on a fixed schedule. Visibility scores that go unreviewed for sixty or ninety days accumulate drops that are harder to reverse. A two-week check catches small shifts while they are still correctable without a full content rebuild.
Visibility Without Context Is Just a Number Going Nowhere
A visibility score without a comparison period, a competitor reference, and a SERP feature check is decorative. It fills a slide. It does not direct work.
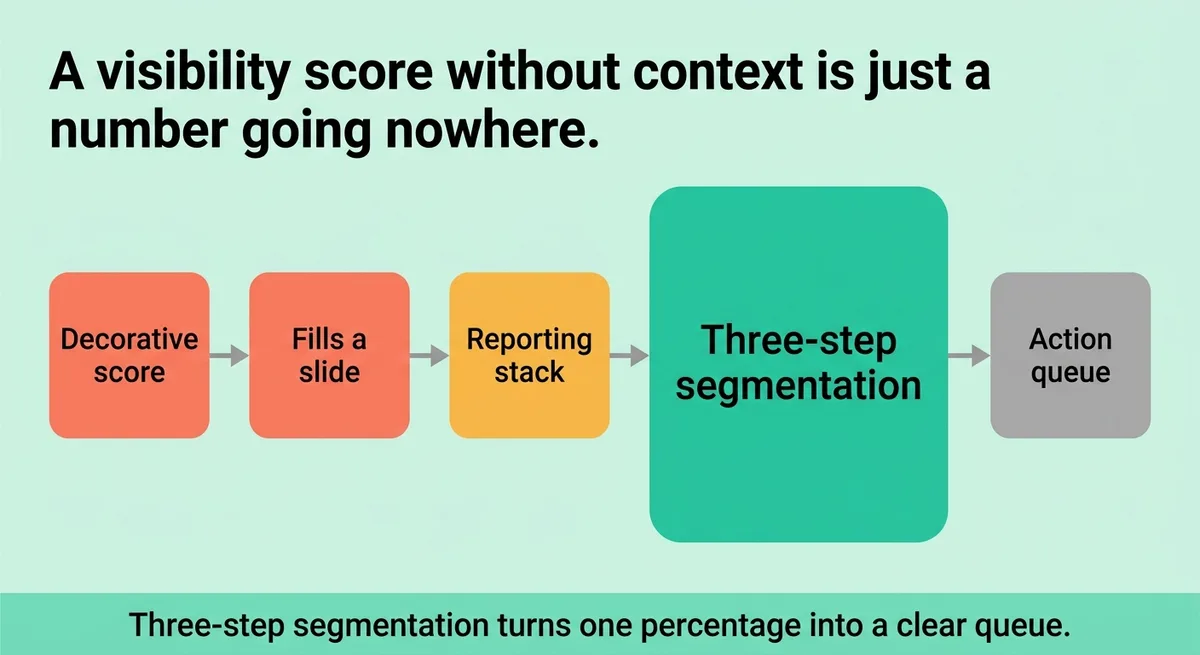
The metric earns its place in a reporting stack when you use the three-step segmentation process: split by keyword type, monitor on cadence, prioritize by difficulty and current position. That sequence turns a single percentage into a queue of specific pages to improve.
For a content lead managing a stalled blog, this gives you a triage list. For an agency founder managing multiple client accounts, it gives you a repeatable audit that does not require rebuilding the analysis from scratch each time.
The score does not tell you what to write. It tells you where you are already close and what is keeping you from capturing the demand that exists.
Check your visibility score by segment this week. Compare it to the same period last quarter. Cross-reference it against Search Console clicks. Then act on the gap.
The Evolution from Traditional Search Visibility to AI Visibility Scores
Marketing executives regularly ask: what is search visibility, what is a good seo visibility score, and what is the ai visibility score? Historically, search visibility was popularized by platforms like Searchmetrics, Sistrix, and Semrush. It measured the percentage of all potential organic clicks your domain captured for a defined keyword set, calculated by multiplying search volume by estimated click-through rate (CTR) based on SERP position.
In modern zero-click and generative search environments, however, organic CTR curves no longer tell the whole story. A user may receive an exhaustive recommendation directly inside ChatGPT without clicking a traditional blue link. This necessitates tracking both your traditional seo visibility score and a dedicated ai visibility score.
An enterprise AI visibility score evaluates three foundational telemetry pillars:
- Citation Frequency (Share of Model): The percentage of simulated industry prompts where your brand or URL is hyperlinked as a cited reference.
- Prompt Grounding Accuracy: The sentiment and factual correctness of how LLMs describe your product capabilities compared to direct competitors.
- Synthetic Impression Share: Modeled reach reflecting the estimated search volume of prompt queries answered by generative search engines.
The Unified Search and AI Visibility Measurement Framework
To evaluate your overall market presence across traditional search engines and generative answer platforms, utilize the comparative diagnostic framework below:
| Dimension | Traditional Organic Visibility Score | Generative AI Visibility Score | Strategic Growth Implication |
|---|---|---|---|
| Primary Metric | Estimated CTR multiplied by monthly search volume (0% – 100%). | Prompt citation rate and brand recommendation share (0% – 100%). | Identifies traffic shifts from classic SERPs to zero-click answers. |
| Monitored Platforms | Google Desktop, Google Mobile, Bing SERP index. | ChatGPT Search, Perplexity, Claude, Google AI Overviews. | Captures the entire omnichannel research journey of prospective buyers. |
| Attribution Vulnerability | Declines when Google AI Overviews occupy page-one screen real estate. | Increases as content is synthesized into authoritative summary answers. | Balances traffic drop-offs with high-intent qualified referral clicks. |
| Remediation Levers | Backlink acquisition, keyword density, and technical page speed fixes. | Syntactic chunking, Schema disambiguation, and firsthand data publishing. | Provides a clear technical roadmap for modern search engine dominance. |
By monitoring both scores in unified dashboards, organizations gain clear visibility into brand reach, market share of voice, and long-term organic revenue growth.
References and Citations
[1]https://www.semrush.com/blog/seo-visibility/
[2]https://ahrefs.com/seo/glossary/search-visibility
[3]https://www.conductor.com/academy/glossary/seo-visibility-faq/
FAQ
Search visibility is a percentage score that measures how much of the total search demand for a tracked keyword set your site captures, calculated by weighting each keyword’s ranking position against its monthly search volume and applying a click-share estimate for that position. A score of 100% means you rank first for every tracked keyword; 0% means you appear for none of them. The metric is more useful than average ranking position because it combines placement and demand into one number, making drops and gains visible before they show up in traffic data.
A rising visibility score without matching traffic usually means SERP features like AI Overviews, image packs, or People Also Ask boxes are absorbing clicks before users reach your organic listing. Image packs appear on roughly 65% of Google results pages, and AI Overviews appear on about 14%, so ranking third organically can still leave your result below the fold. The fix is to cross-reference your visibility score with Google Search Console click data and check which SERP features are active for your highest-volume tracked keywords before drawing conclusions from the score alone.
There is no universal benchmark because the score depends entirely on the keyword set you are tracking, but a concrete comparison matters more than an absolute target: three sites tracking the same ten keywords might score 24.45%, 14.45%, and 0.6%, and that spread tells you immediately where you stand competitively. A score of 3.11% on a broader tracked set can represent real progress if it was 1.8% six months earlier. Platforms like Zelitho are built to help content teams track this progress across topic clusters and publishing cadences so the score stays connected to an actual content queue rather than sitting as a standalone dashboard number.
The fastest path to improving search visibility for a stalled blog is to segment your tracked keywords by type (branded, informational, commercial), identify which segment dropped, then filter for keywords below 30% keyword difficulty where you already rank between positions 5 and 15 and prioritize those pages for improvement. Moving from position 12 to position 4 on a keyword you already rank for requires far less effort than building a new page from scratch, and backlinks remain a top ranking factor, so pages with strong relevance but few links are high-leverage targets. Zelitho addresses the operational side of this problem by connecting keyword discovery, draft generation, and CMS publishing into one workflow so teams can act on a prioritized keyword list without the handoff delays that stall most blog production.
Average ranking position tells you where your pages sit in search results, while search visibility tells you how much of the actual search demand you are capturing by weighting each keyword’s position against its monthly search volume. A site can hold an average position of 4.2 and still capture almost no traffic if its tracked keywords carry very low search volume, because position is a placement stat and visibility is a demand stat. Improving rank from position 8 to position 2 on a 5,000-search-per-month keyword moves visibility materially; the same positional gain on a 50-search-per-month keyword barely registers in the score.